
| 2011 | 31,674 USD Millions |
|---|---|
| 2012 | 30,809 USD Millions |
| 2013 | 35,134 USD Millions |
| Service & Leisure | 2,241 USD Millions |
|---|---|
| Manufacturing & Construction | 14,244 USD Millions |
| Finance | 18,649 USD Millions |
| 2011 | 87,713 USD Millions |
|---|---|
| 2012 | 104,447 USD Millions |
| 2013 | 117,040 USD Millions |
| Service & Leisure | 5,459 USD Millions |
|---|---|
| Manufacturing & Construction | 21,624 USD Millions |
| Finance | 89,957 USD Millions |
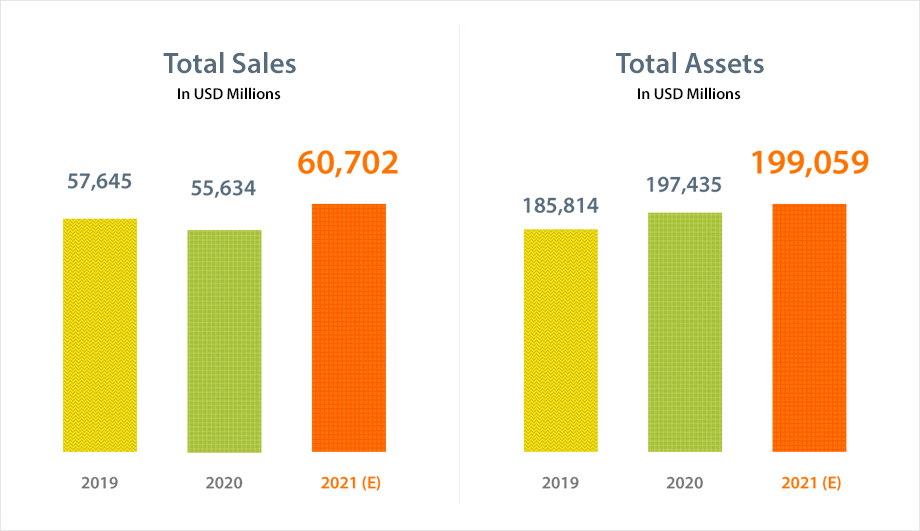
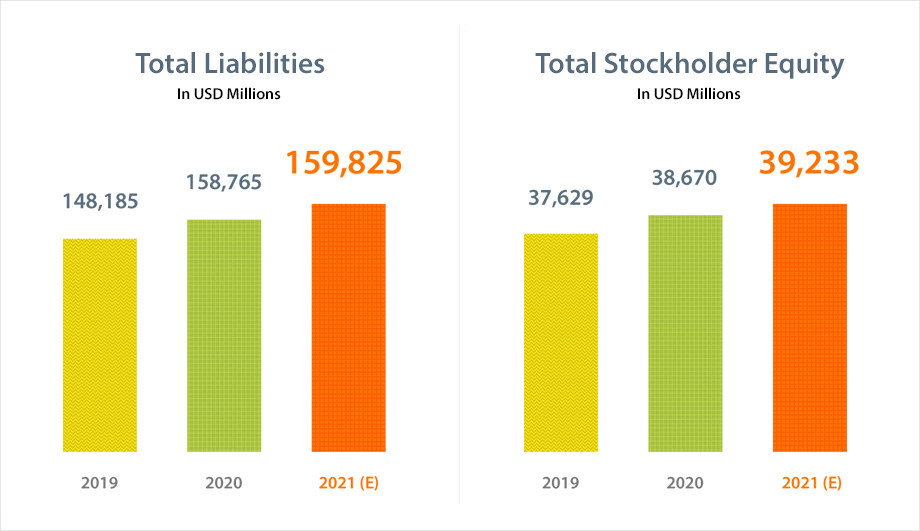
- * The financial data in the Financial Highlights show the simple aggregate of sales, total assets, total liabilities, and total stockholder equity among Hanwha Group’s major affiliates at home and abroad. (Source: Hanwha Group)
- * Figures for sales and total assets of individual affiliate companies published on page 75 and subsequent pages of this brochure are data officially announced by the Financial Supervisory Service.
- * This outlook data was generated prior to completing the internal financial statements, accounting reviews, and an external audit report and are therefore subject to change upon settlement of accounts and accounting audit results. The outlook data also include information on forecasts that may be affected by risks, market conditions, uncertainties, or changes in circumstances. In addition, the actual results may differ from the published or suggested content herein, and may change without prior notice due to shifts in market conditions and change in strategies. This data was generated for reference purposes only. Hanwha Group has no obligation to set or change expectations and forecasts for the future contained herein. The data contained herein must not be used for investment purposes. Hanwha Group does not provide any guarantee for the data and its contents, and has no liability or responsibility for the outcome of investments made based on this data.
- * Sales are converted into US dollars at the average exchange rate of USD 1= KRW 1,165.65 in 2019, and KRW 1,180.05 in 2020.
- * Assets, liabilities, and shareholder equity amounts are converted into US dollars at the December 31 closing exchange rate of USD 1= KRW 1,157.80 in 2019, and KRW 1,088.00 in 2020.
- * The 2021 expectancy data was converted based on Hanwha Group’s internal exchange rate of USD 1=KRW 1,100 for sales and 1,090 for others.
